YOLOv8 · Custom Training Pipeline · 5 Data Sources
Training Dataset
& Collection Pipeline
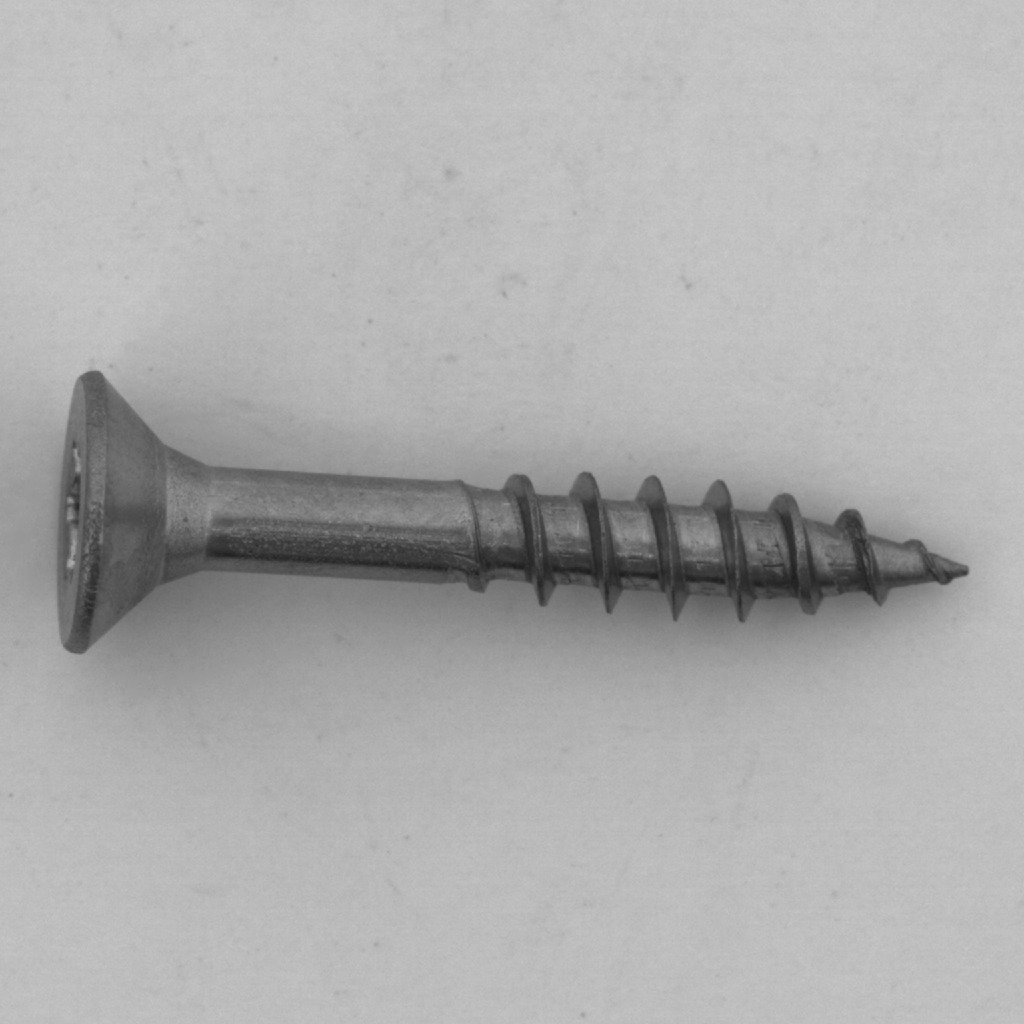
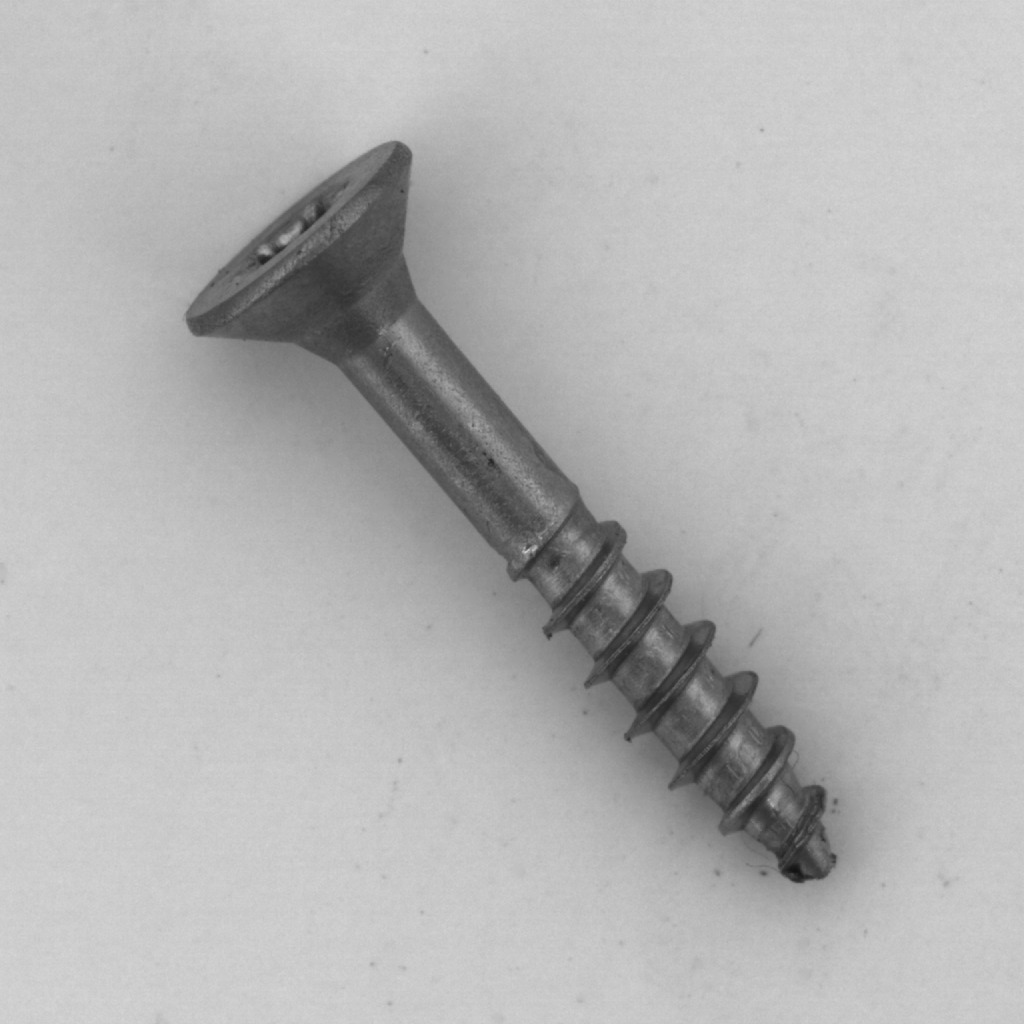
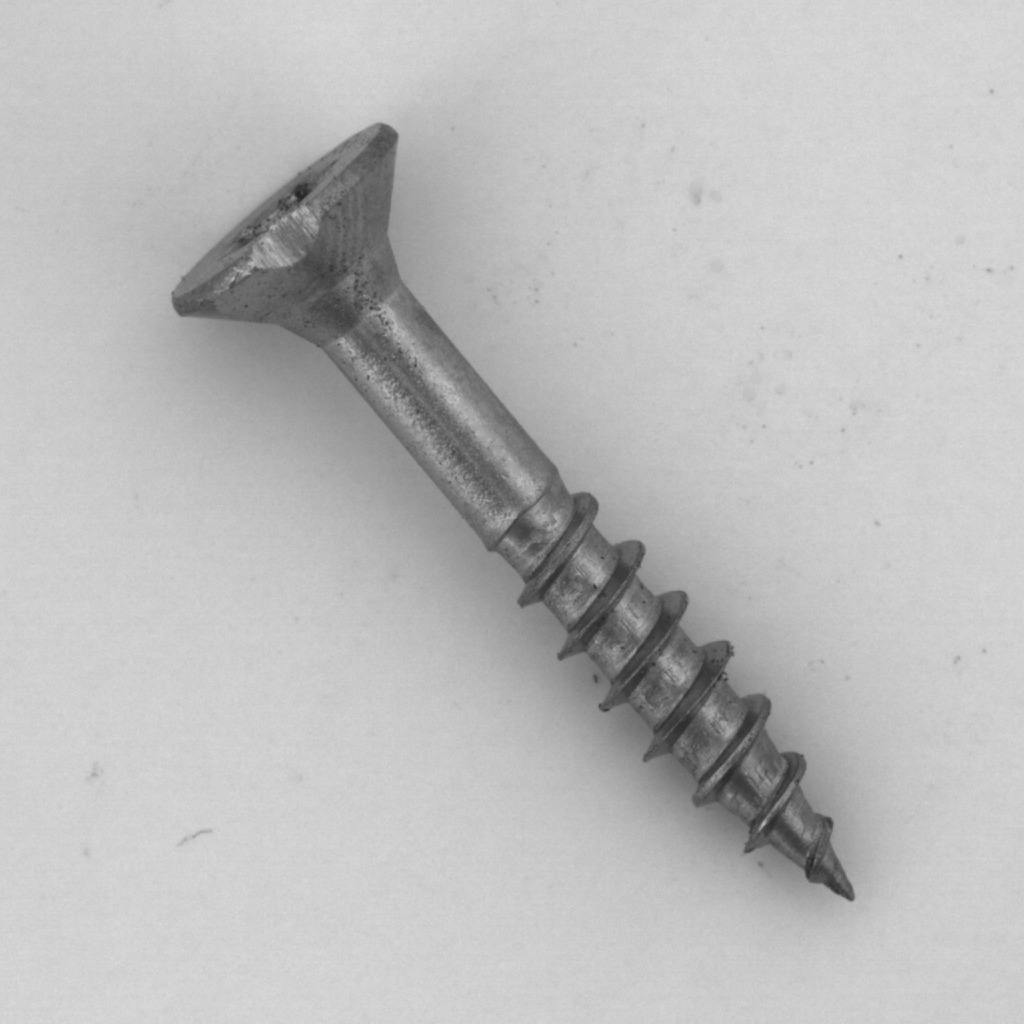
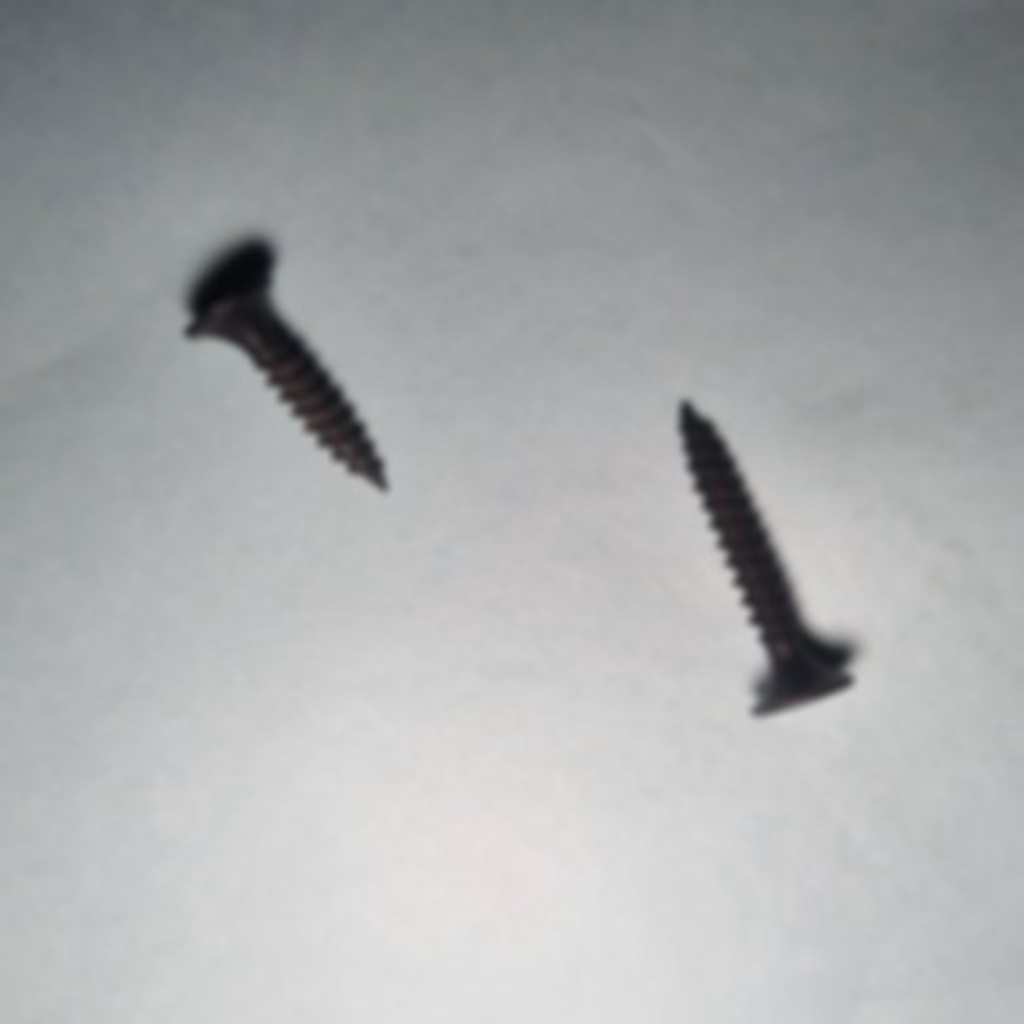
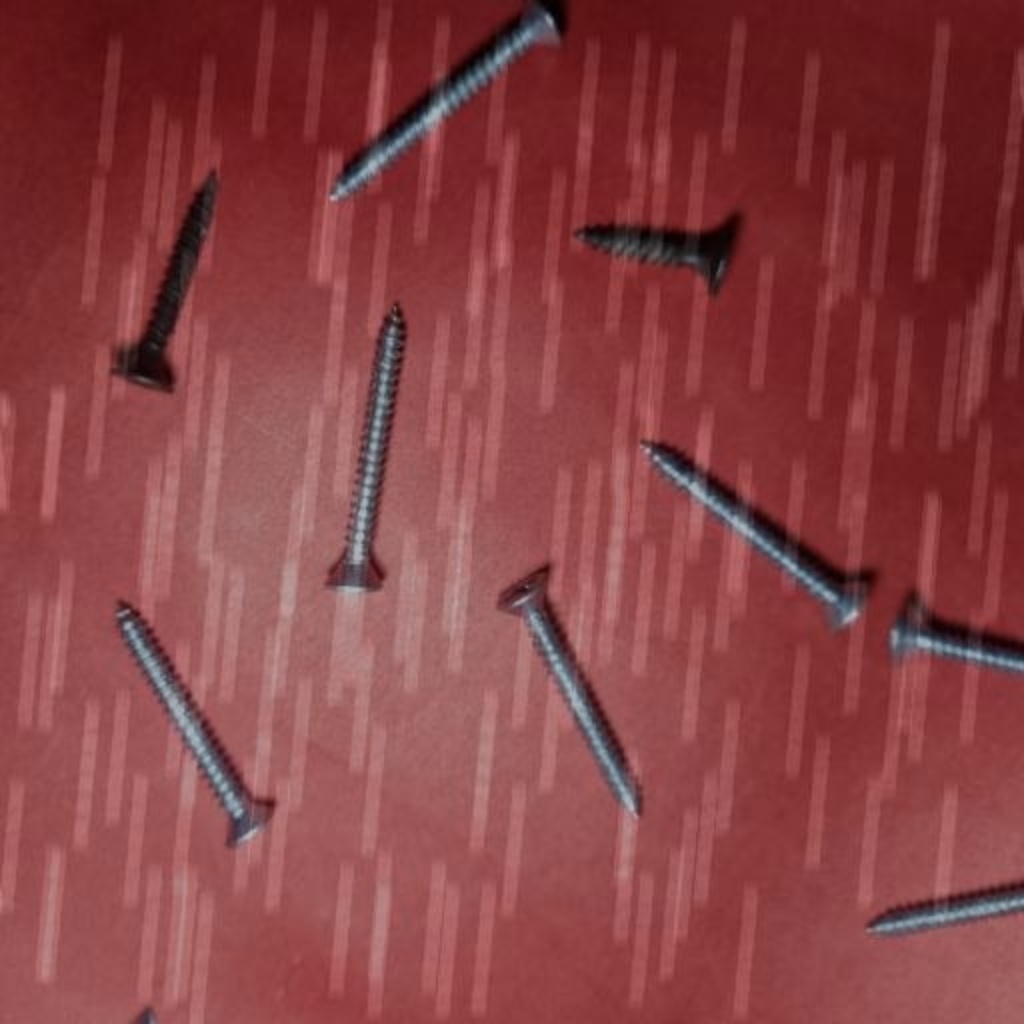
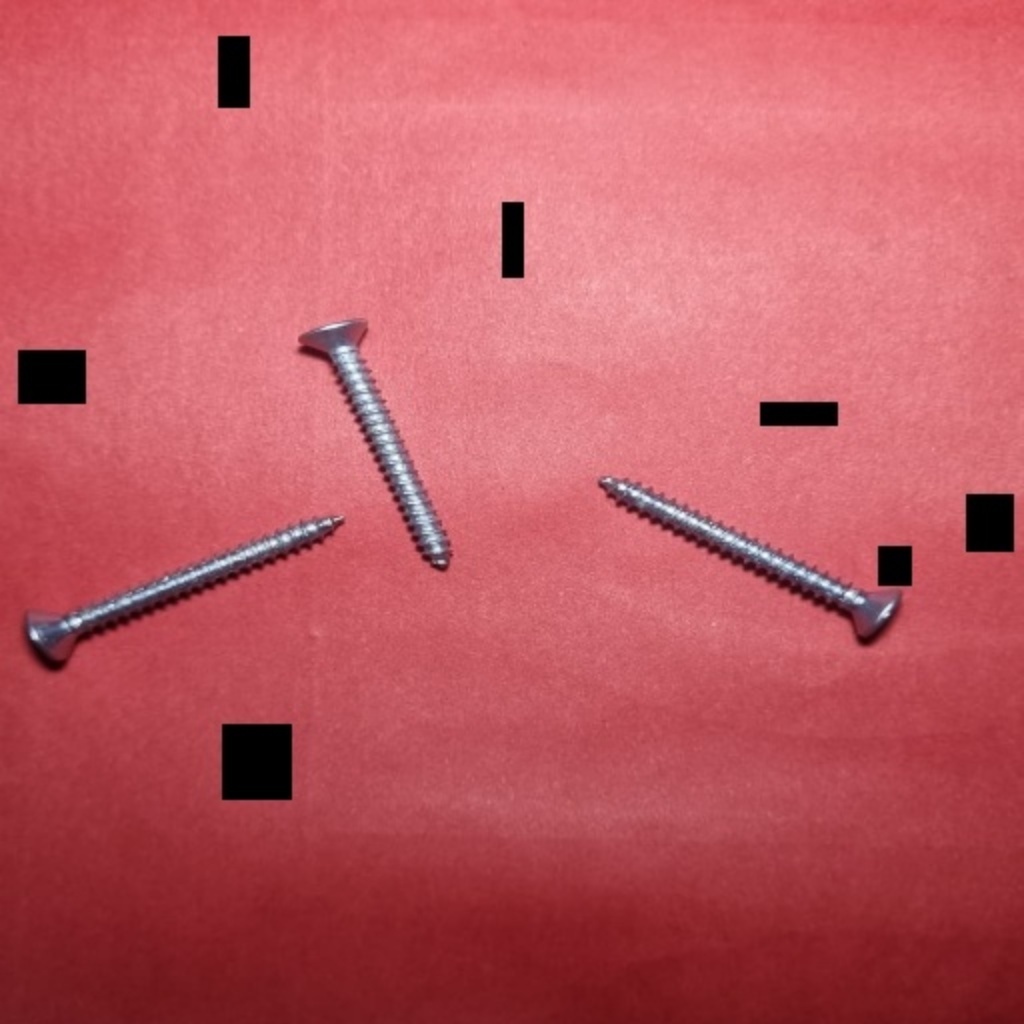
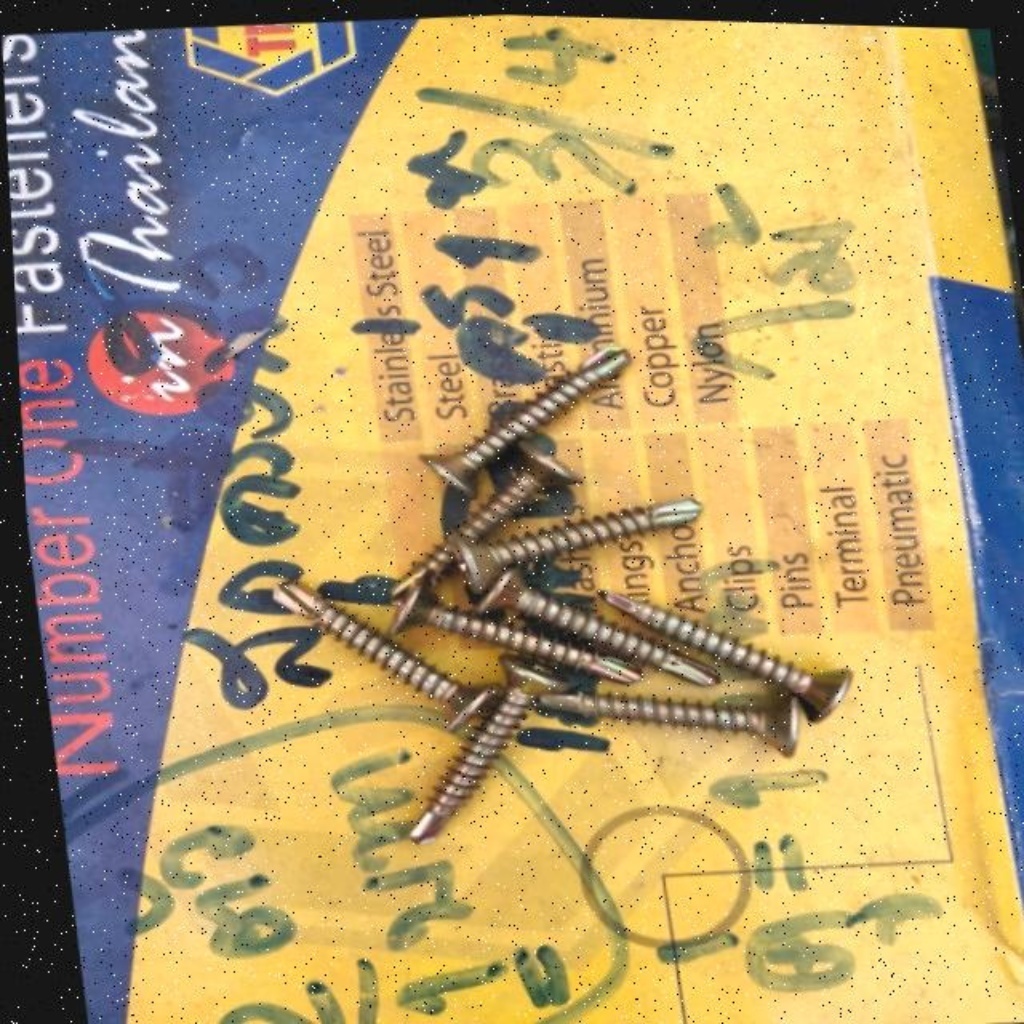
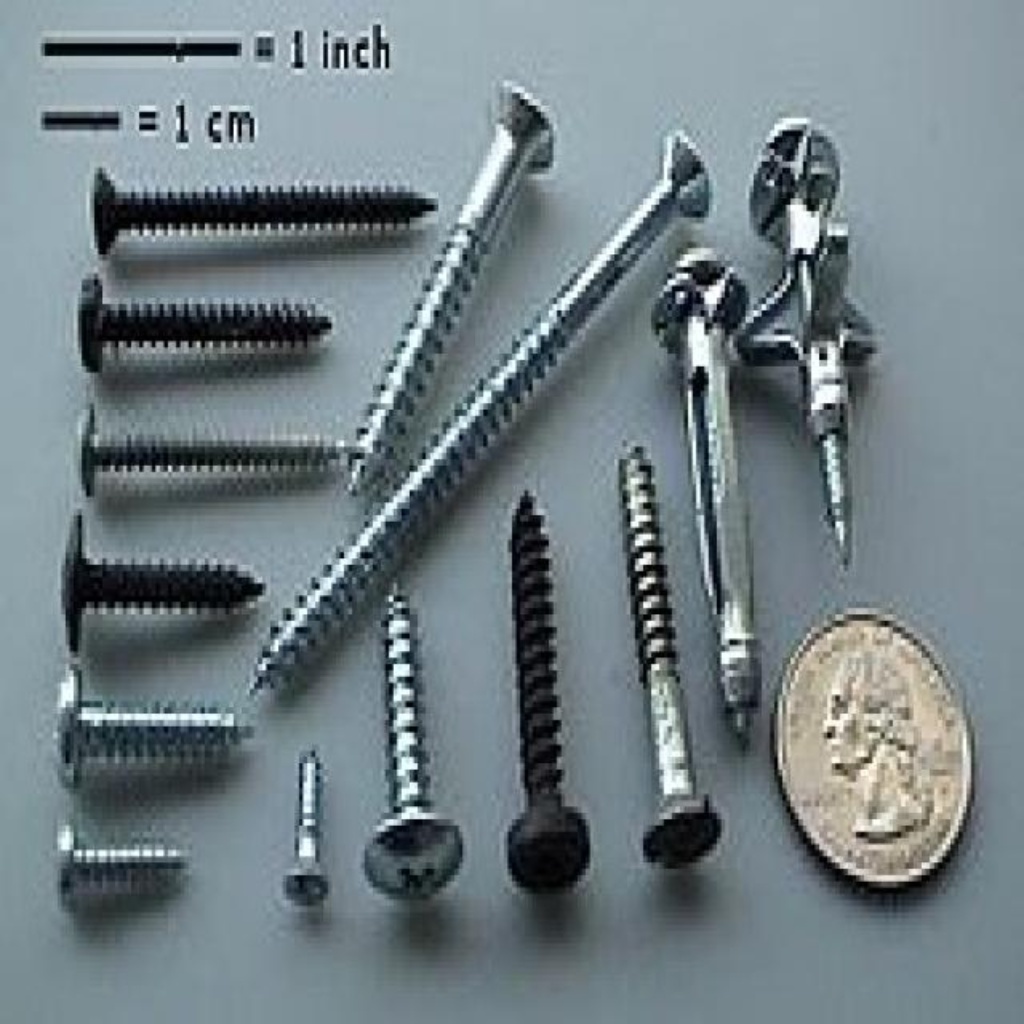
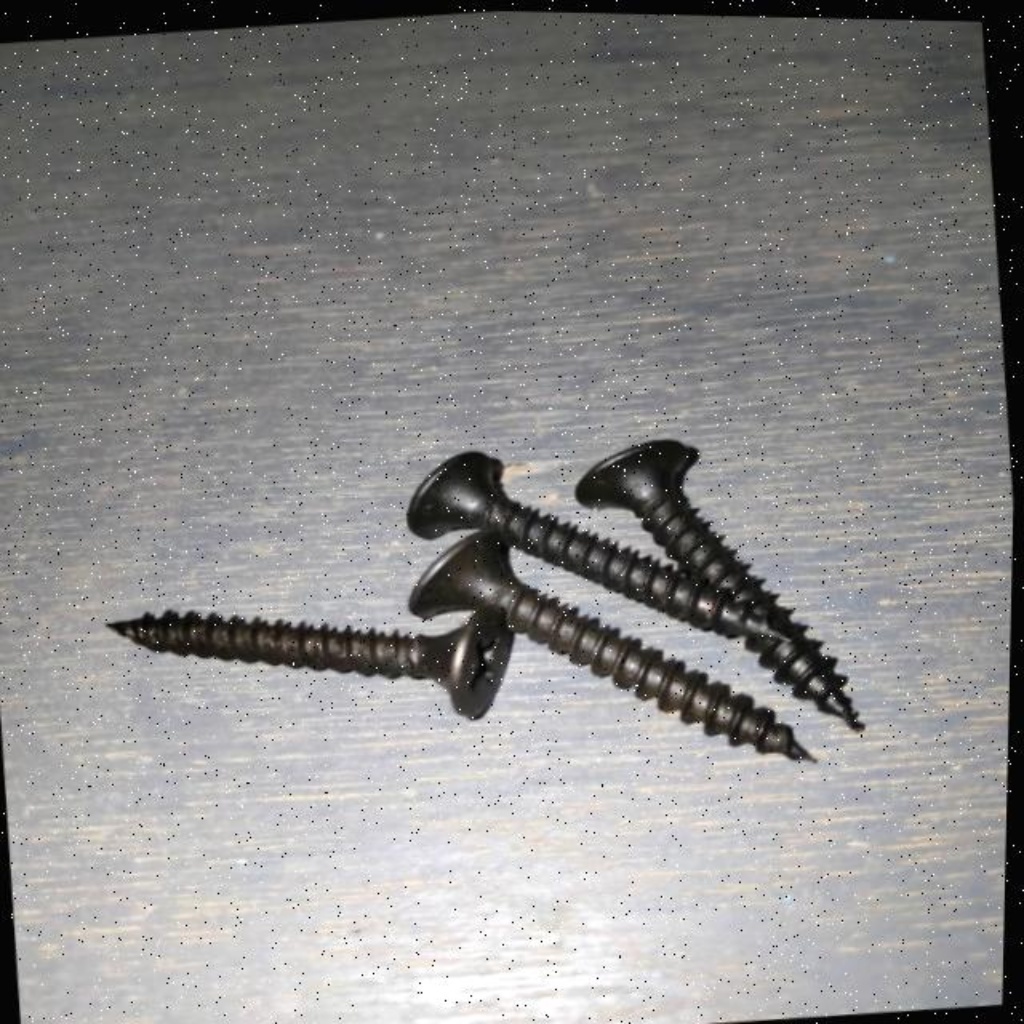
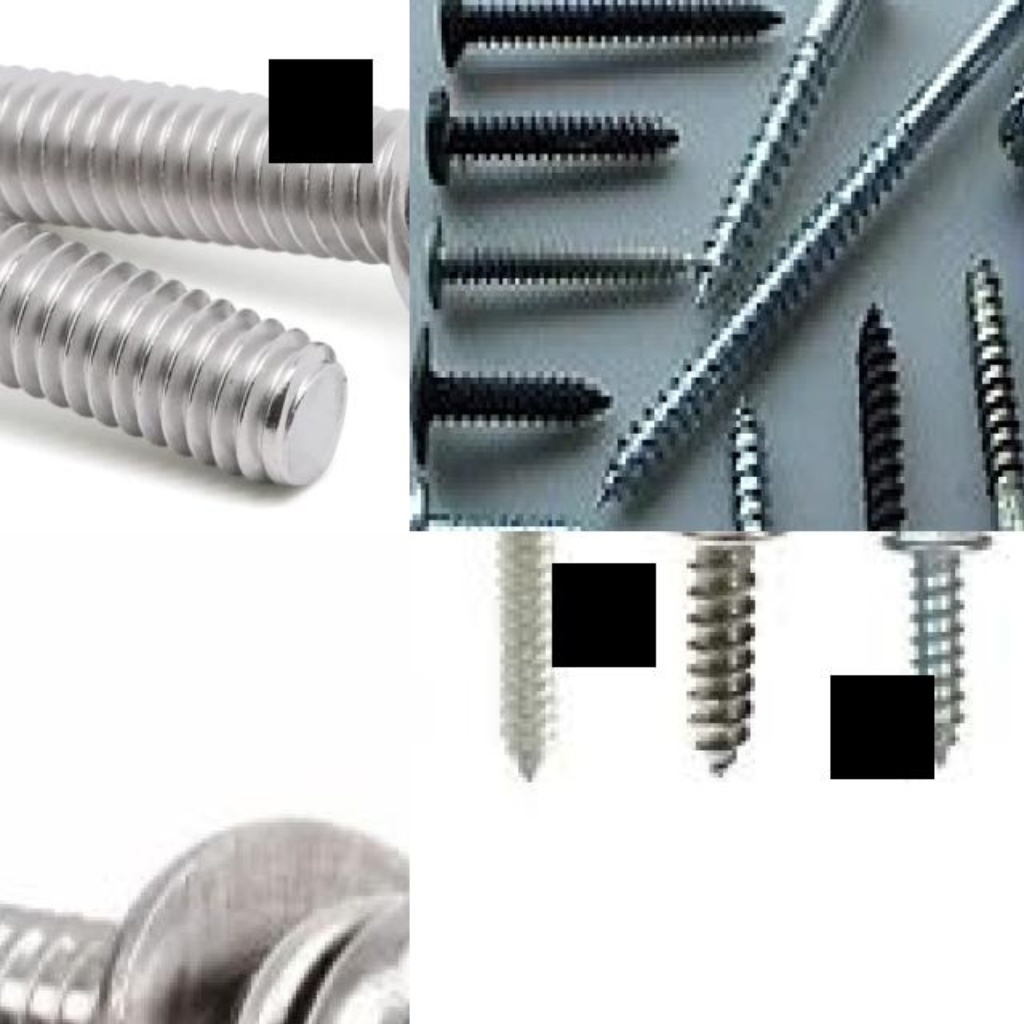
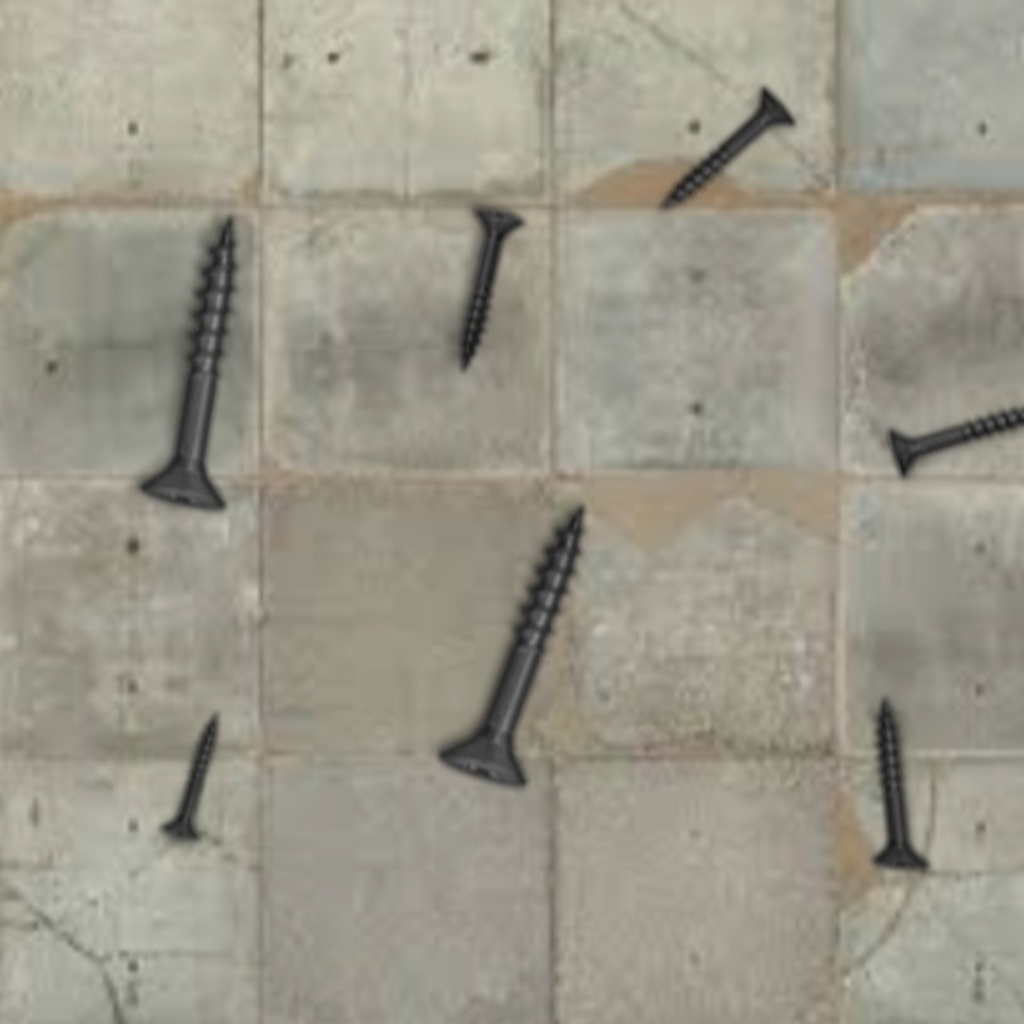
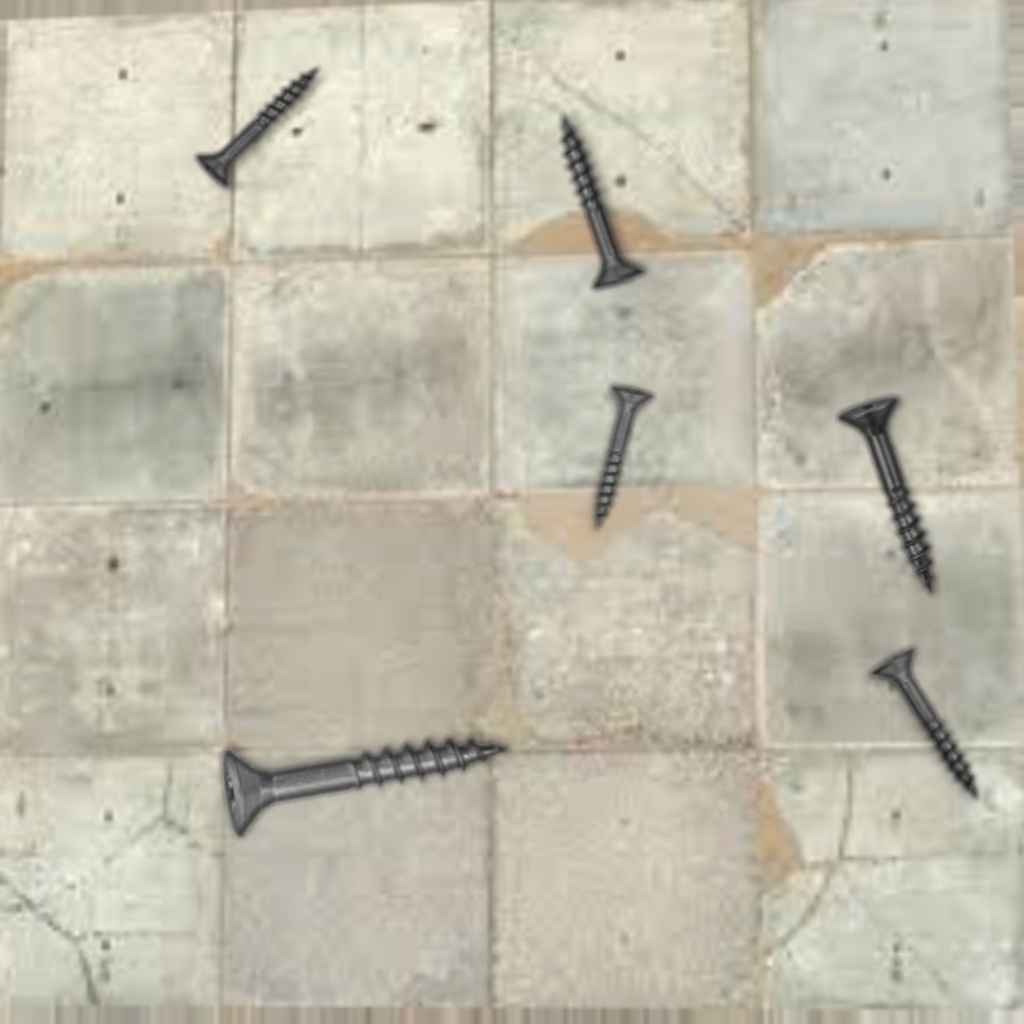
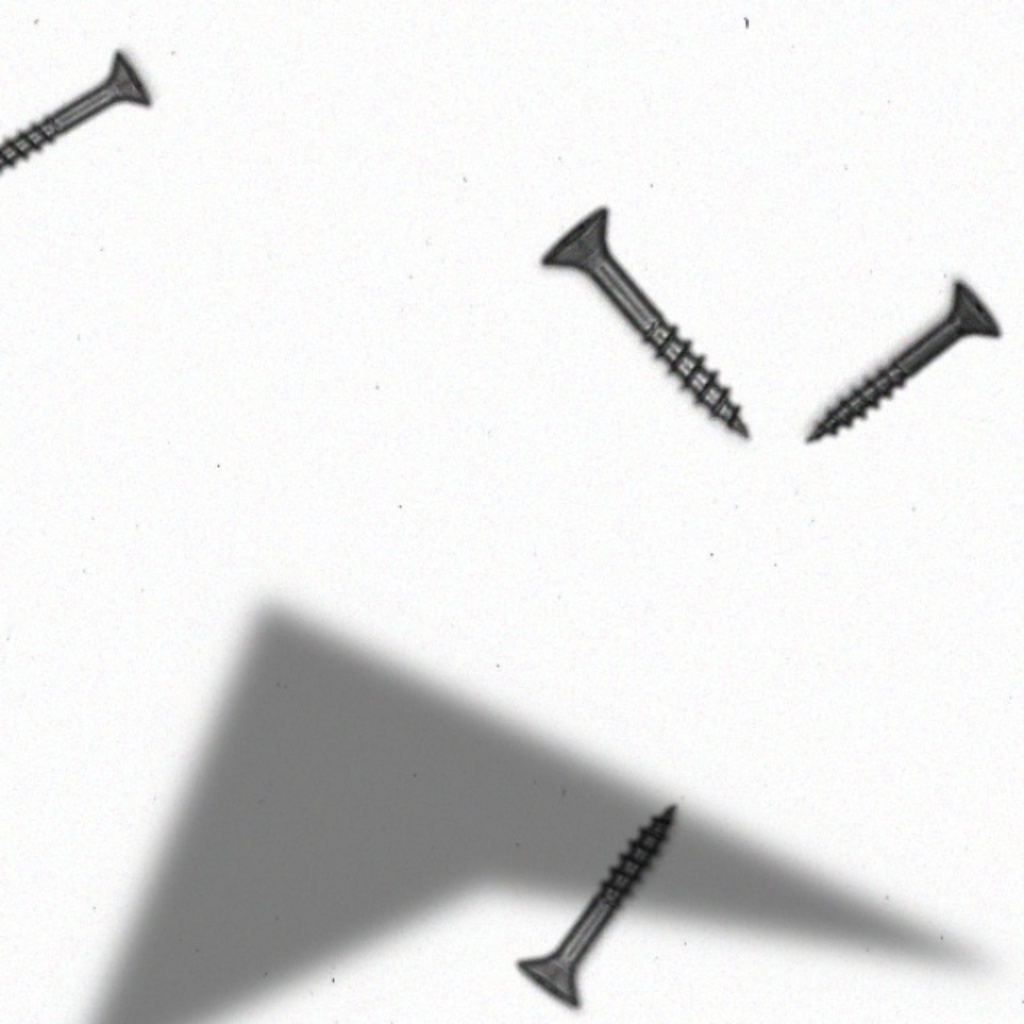
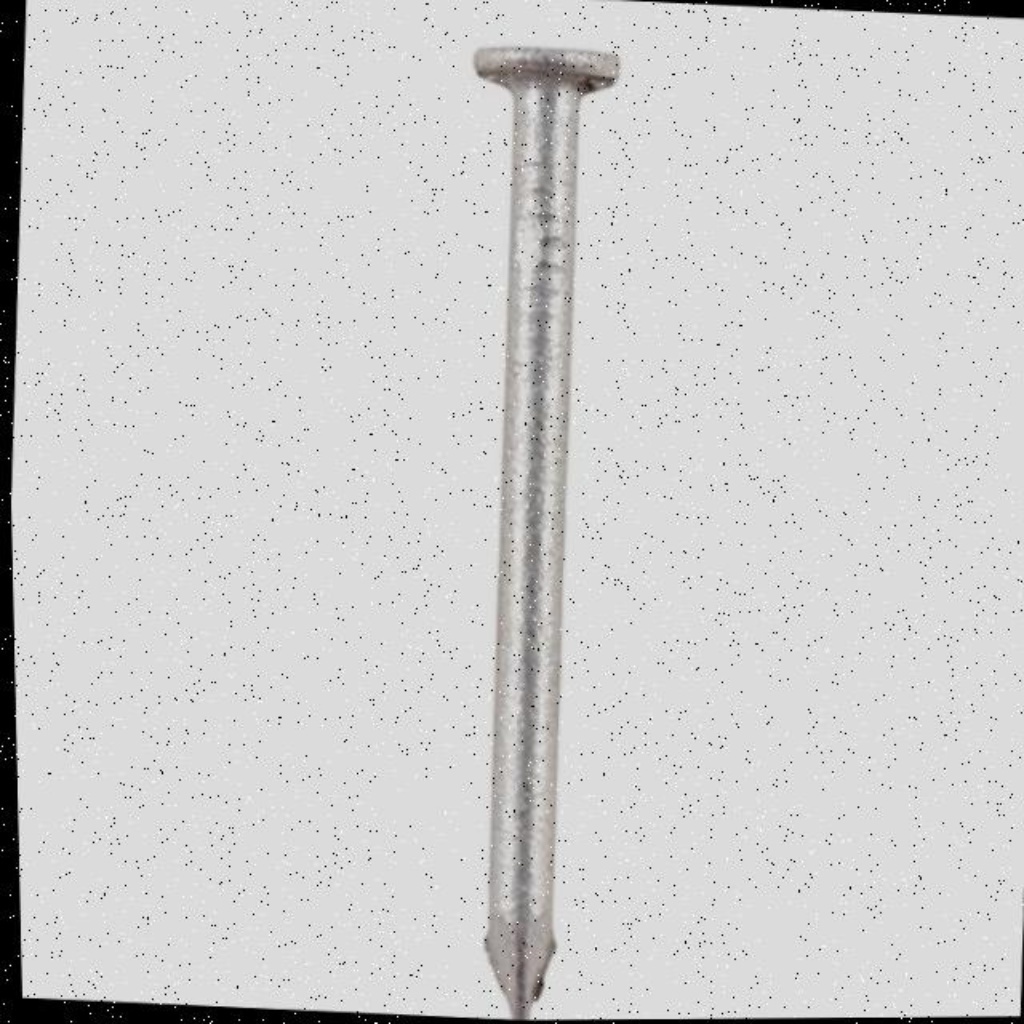
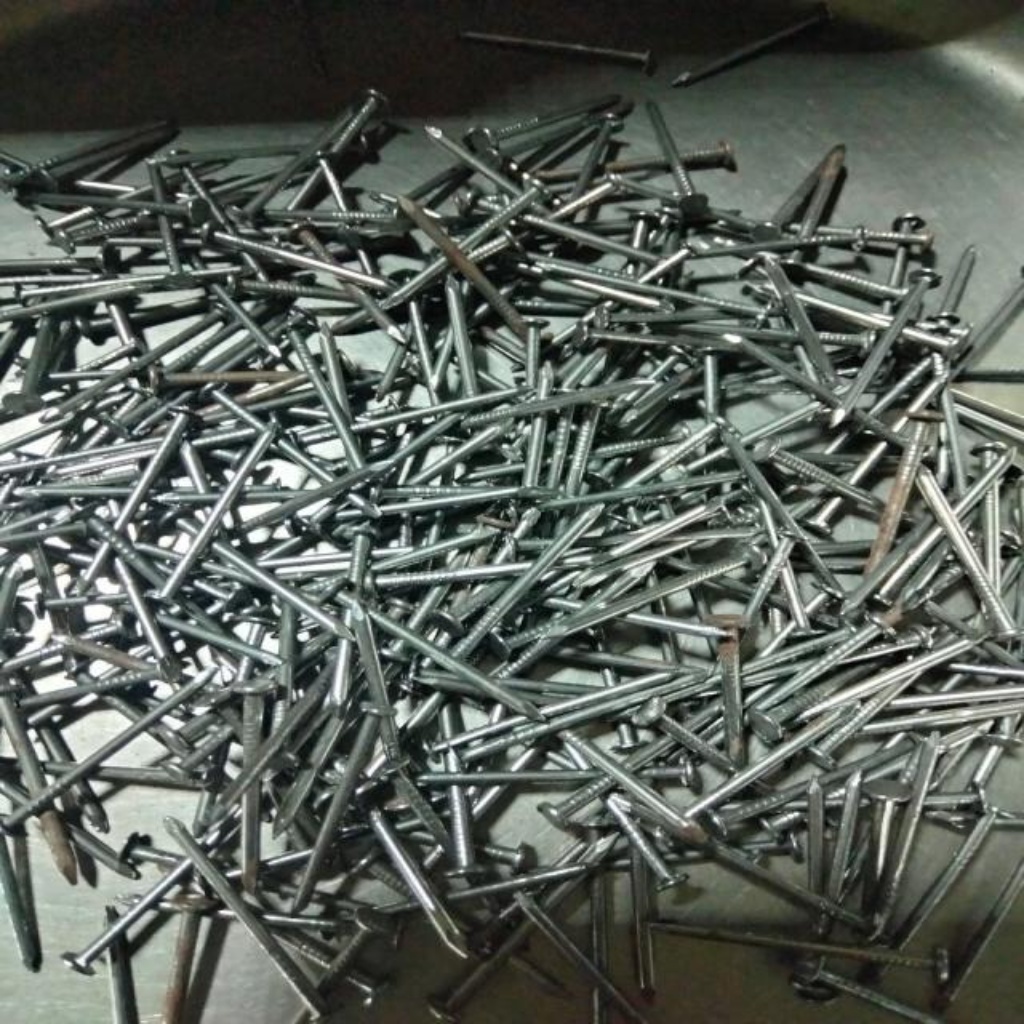
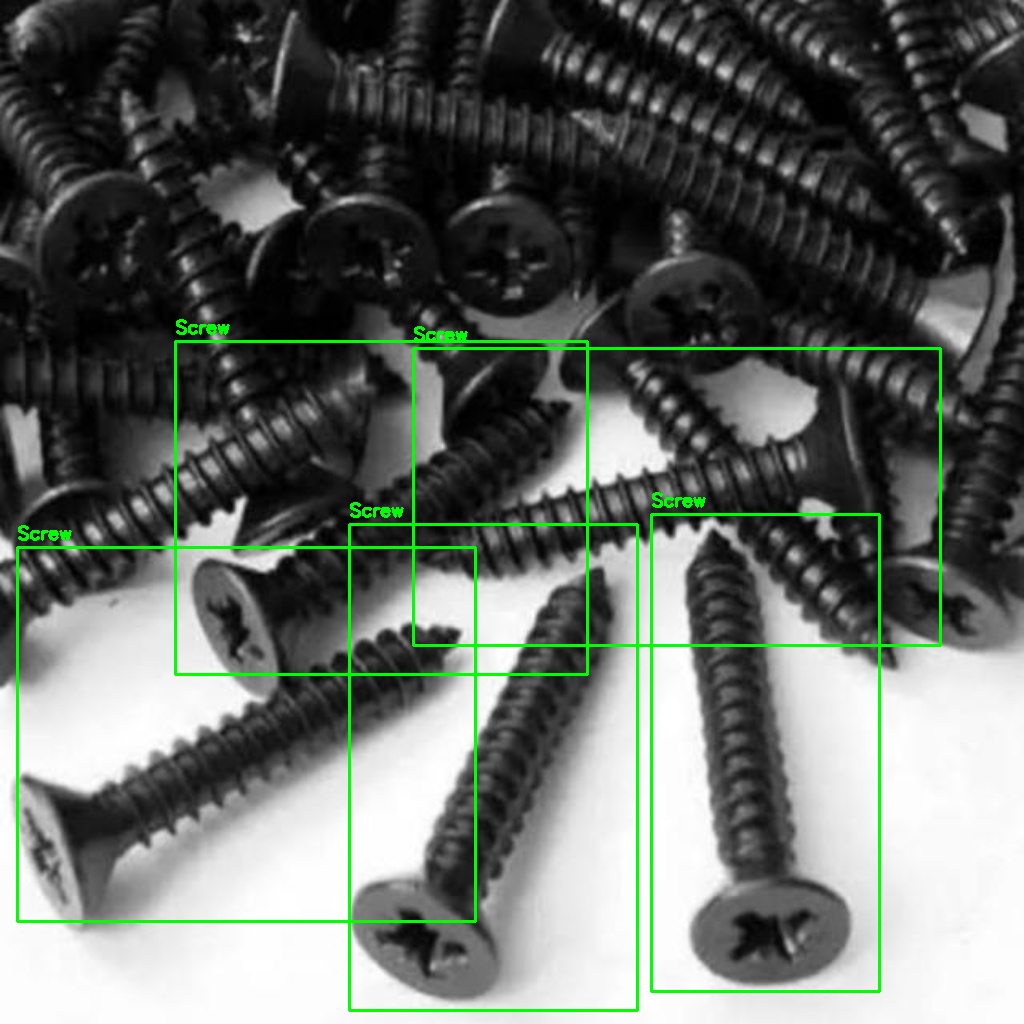
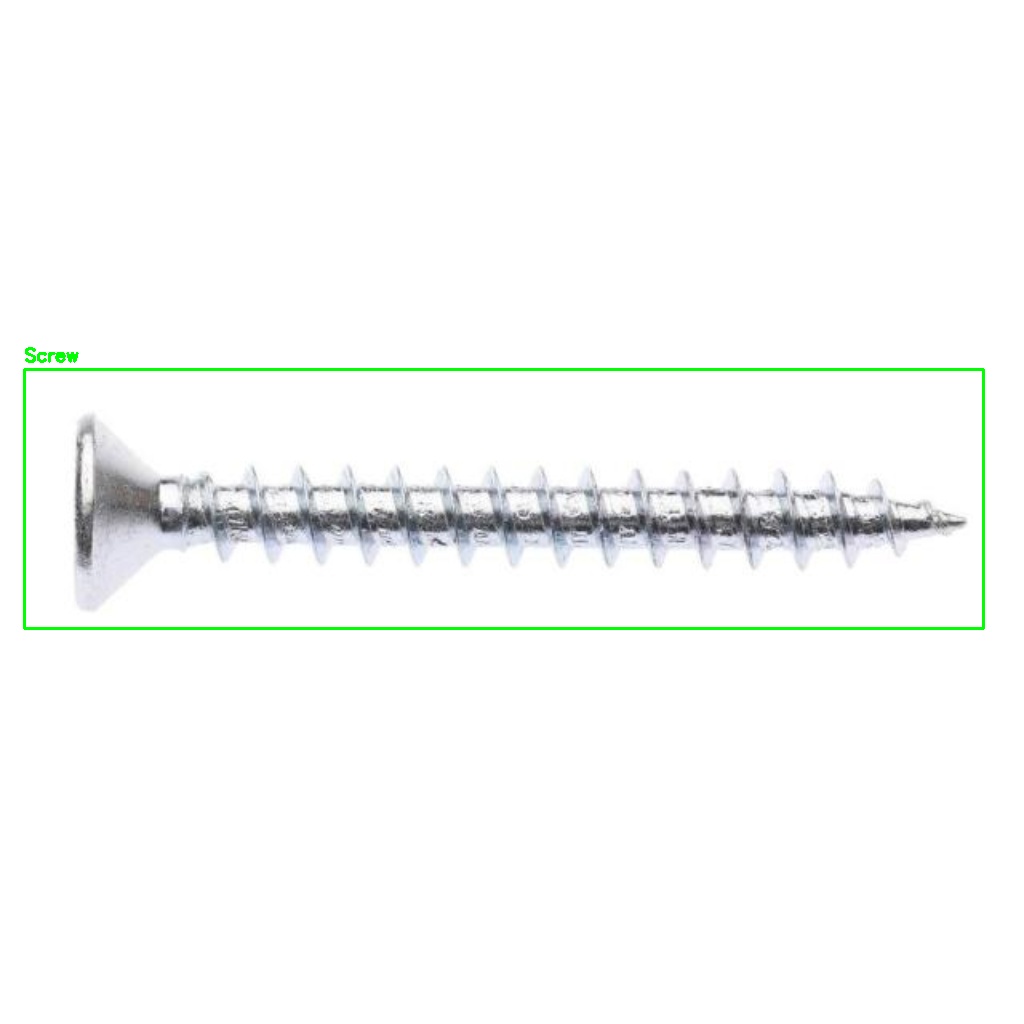
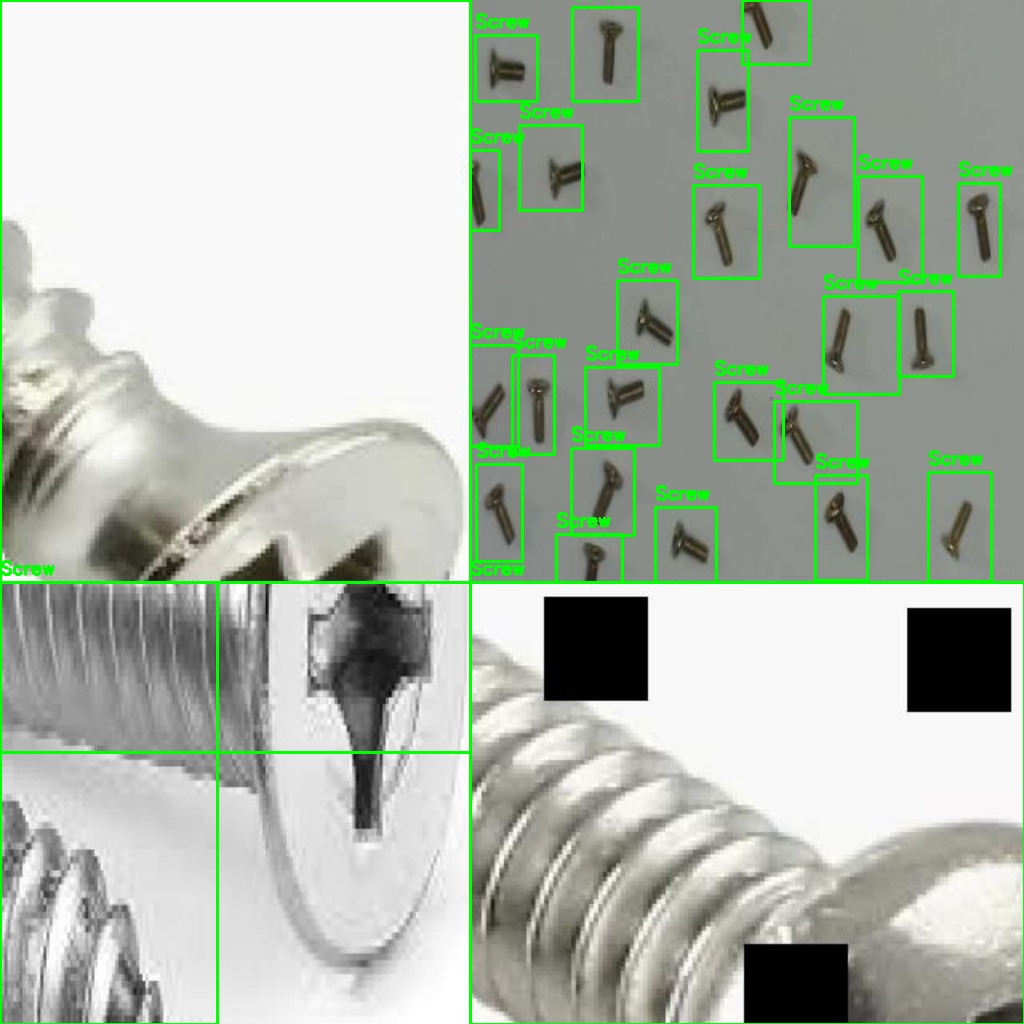
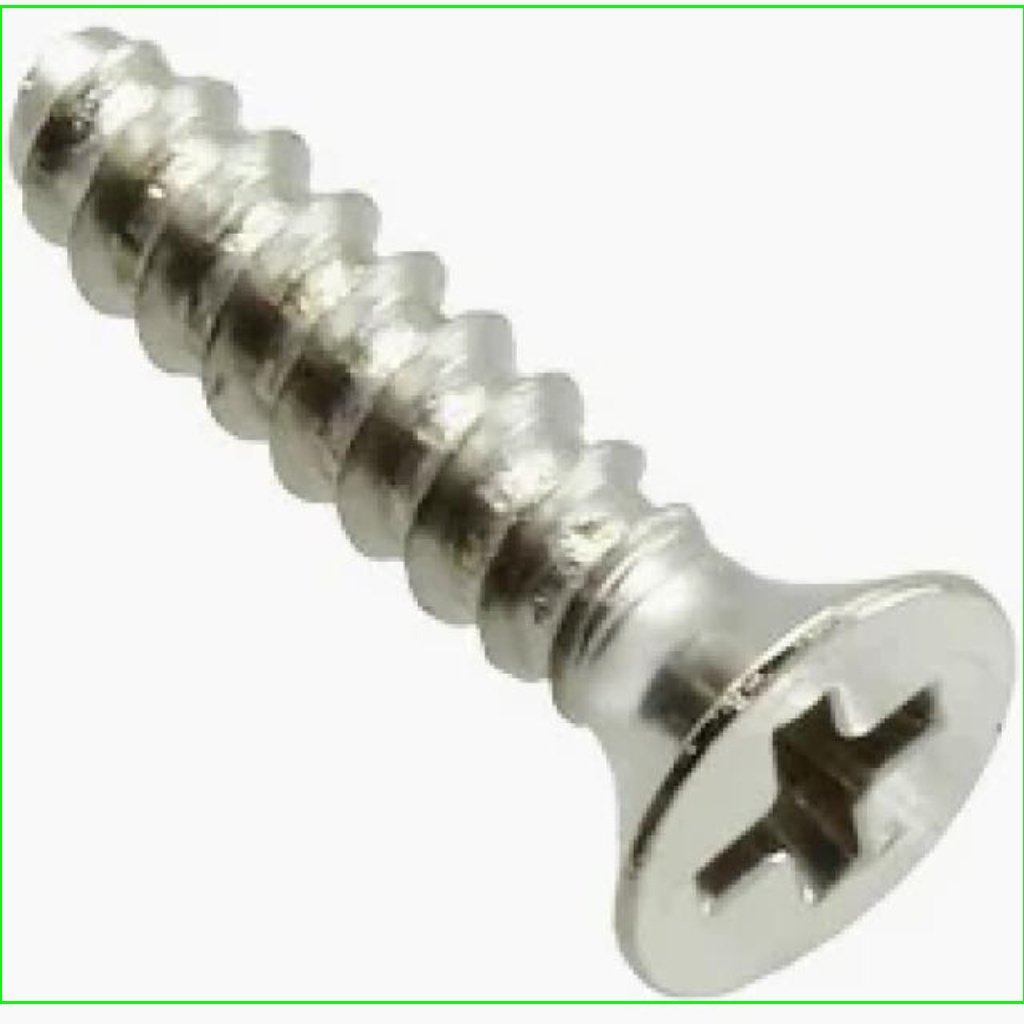
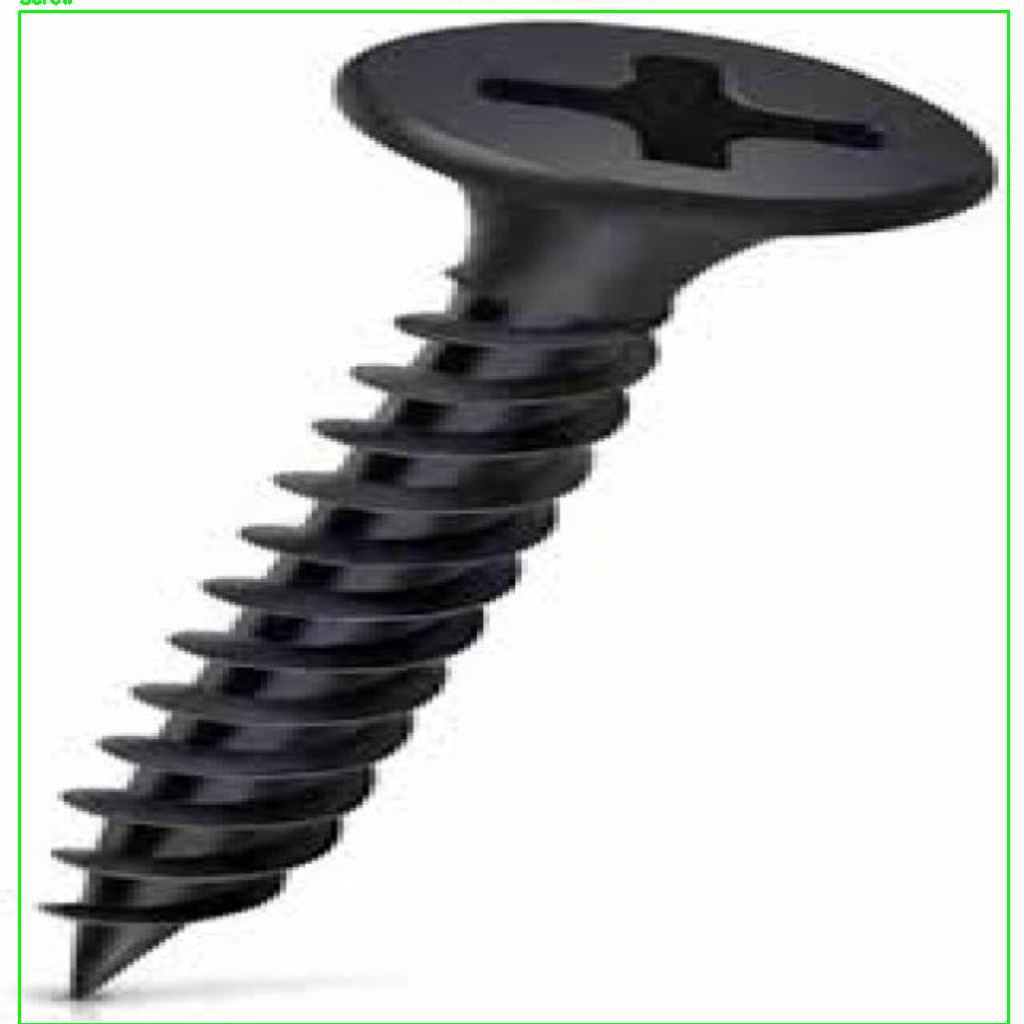
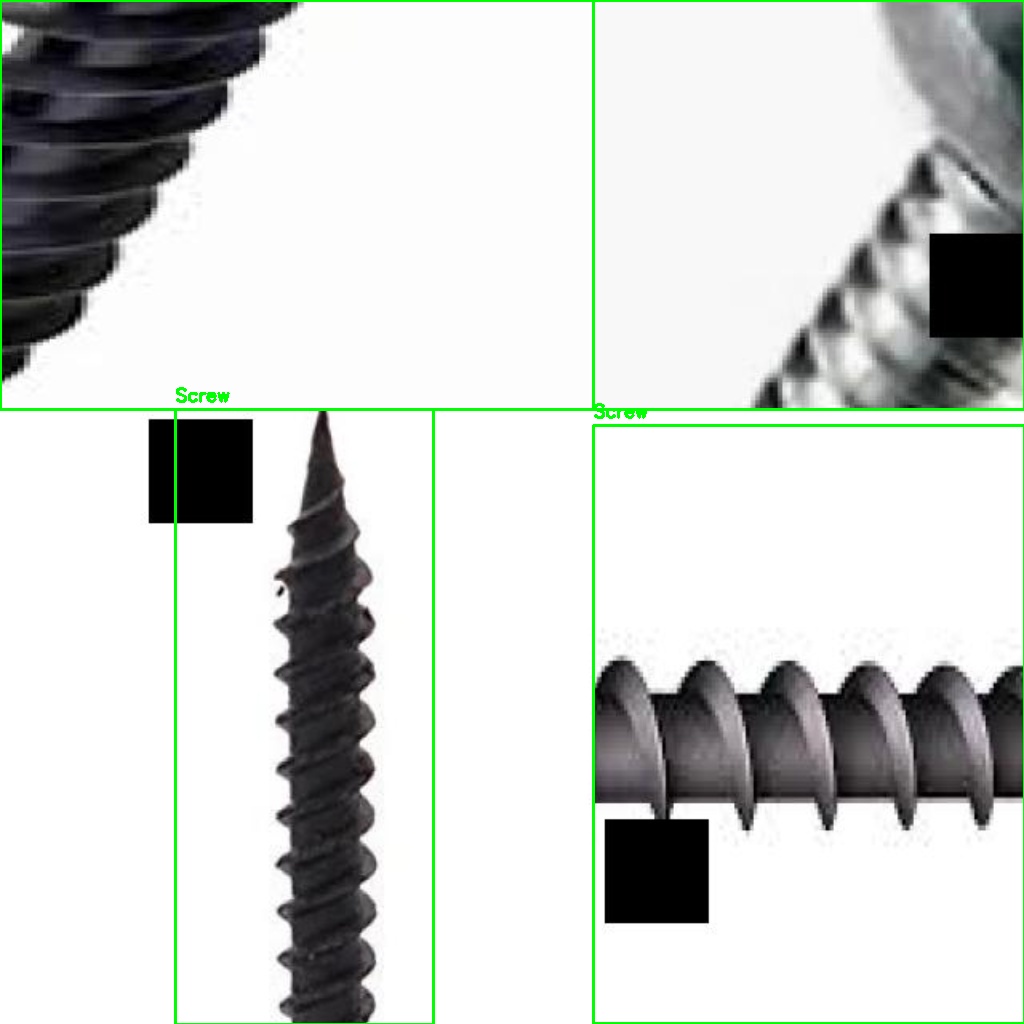
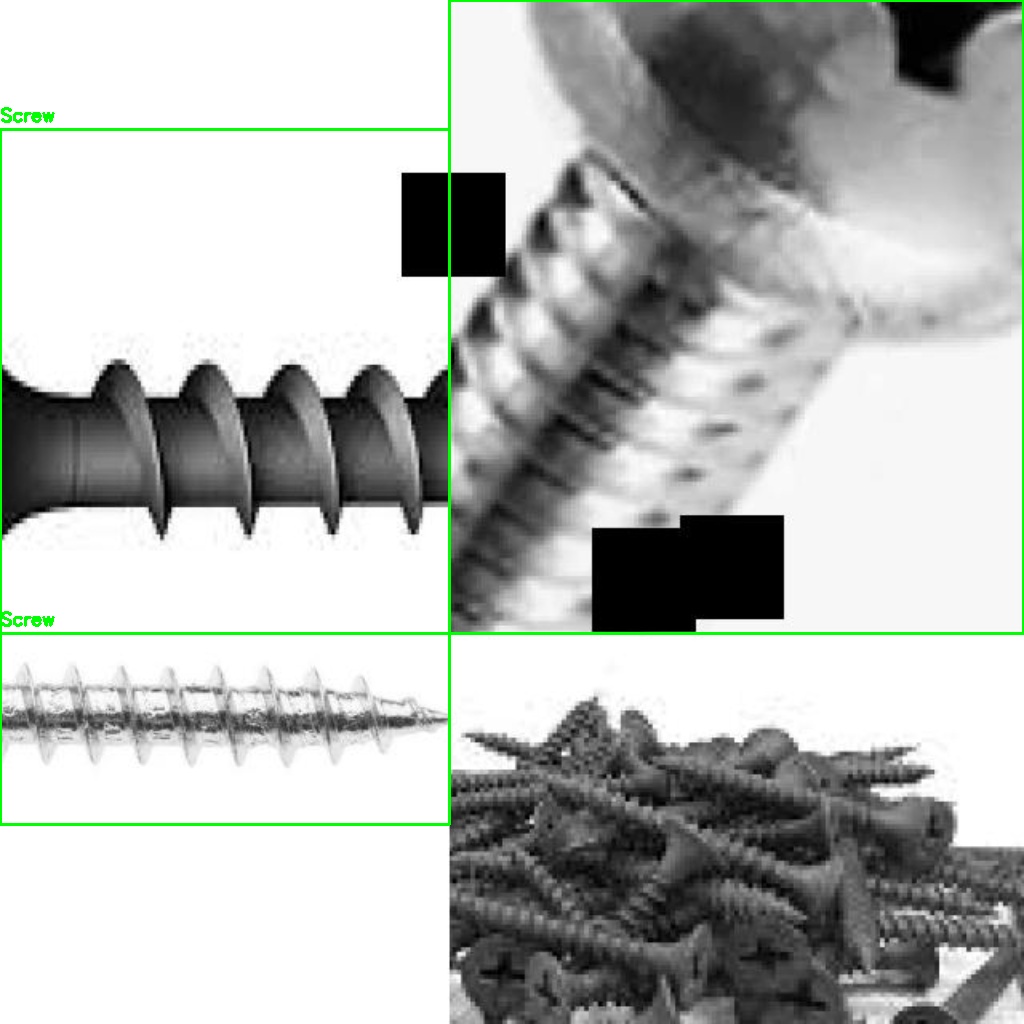
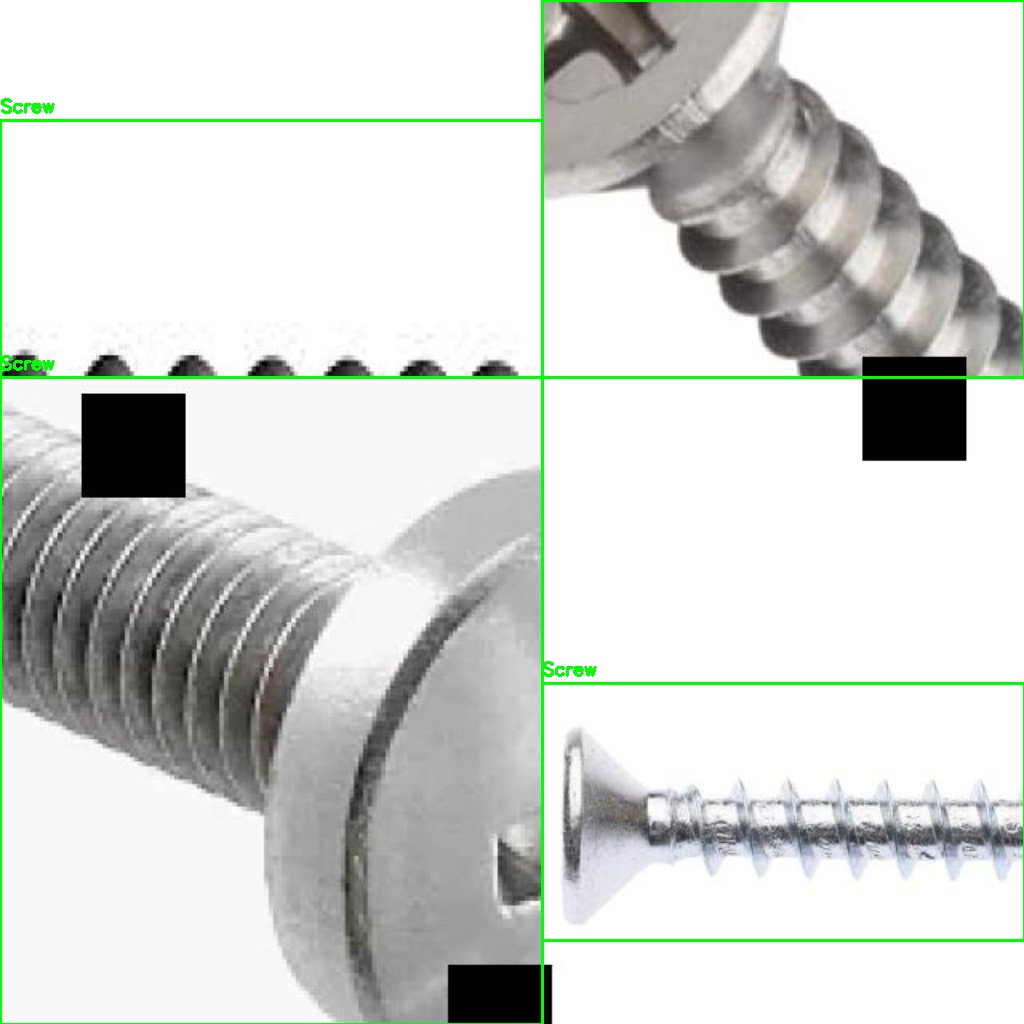
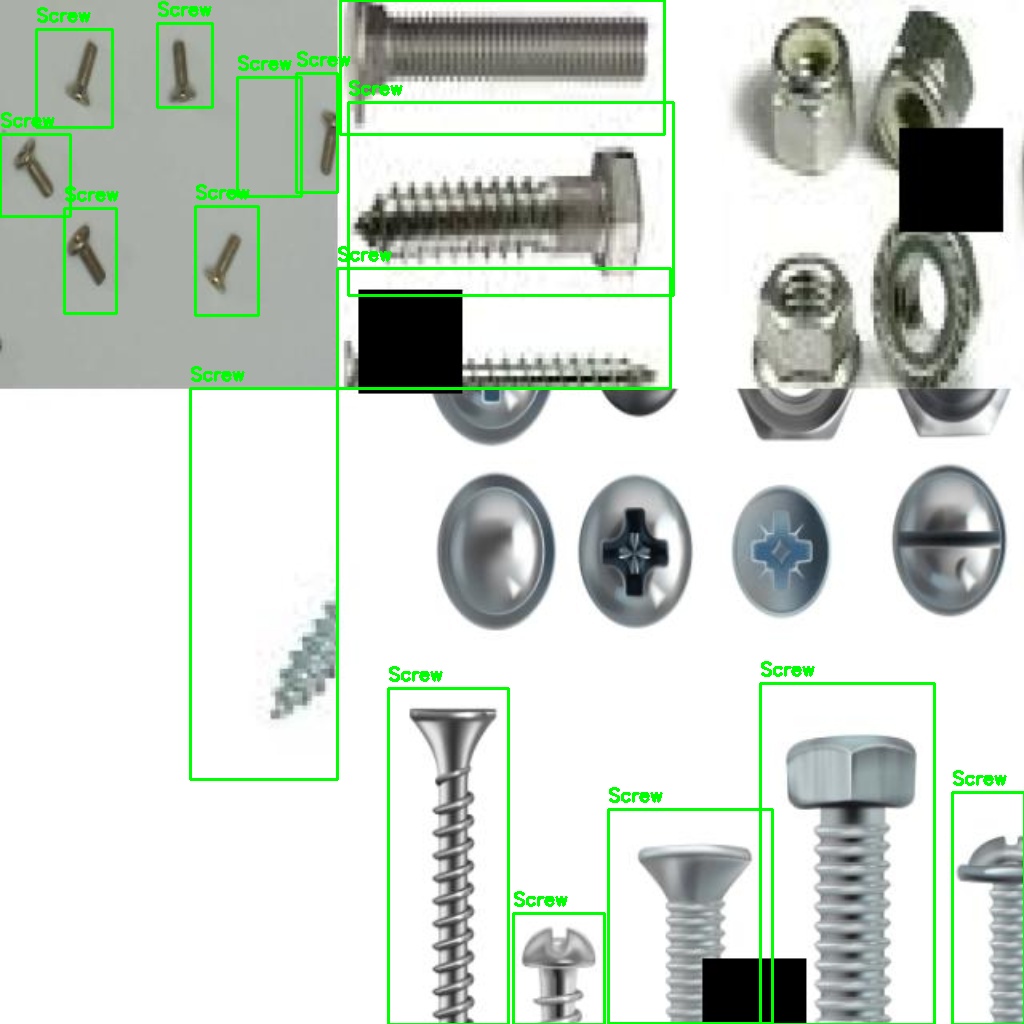
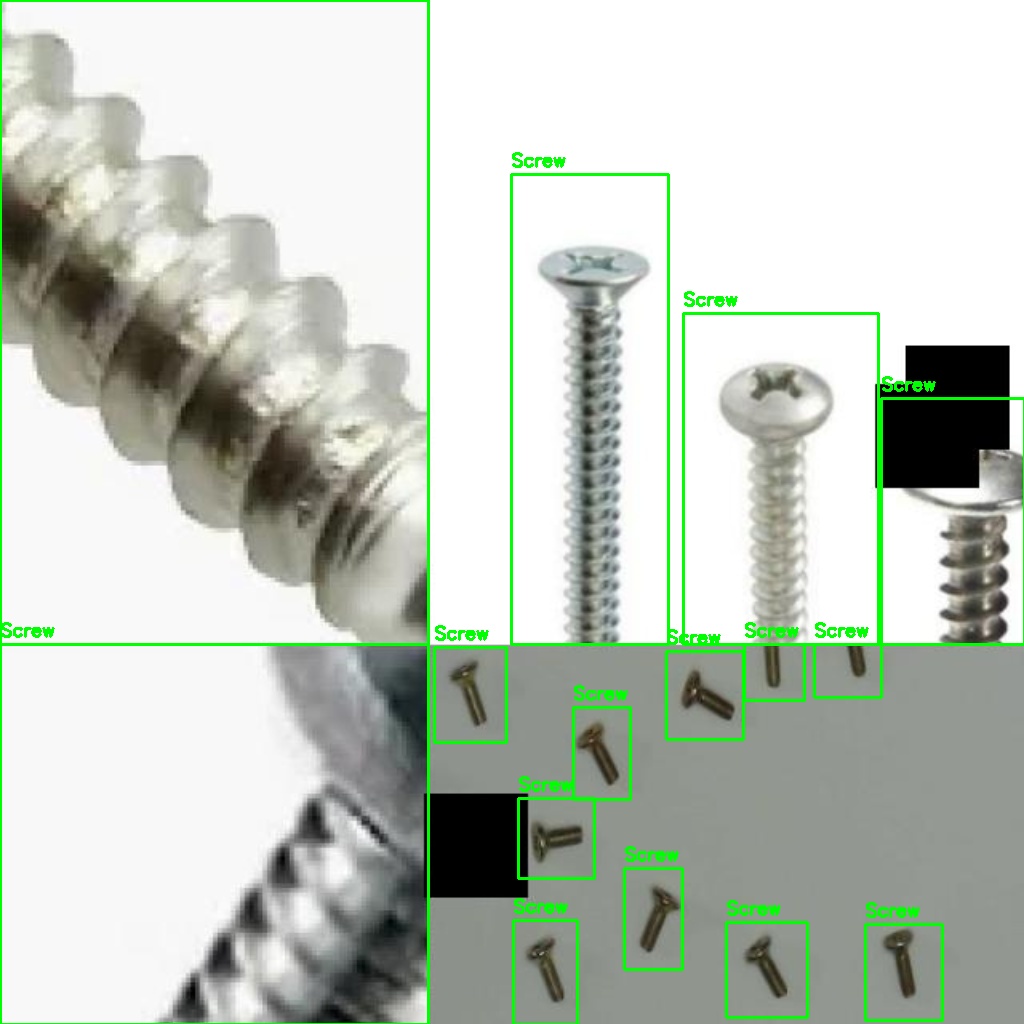
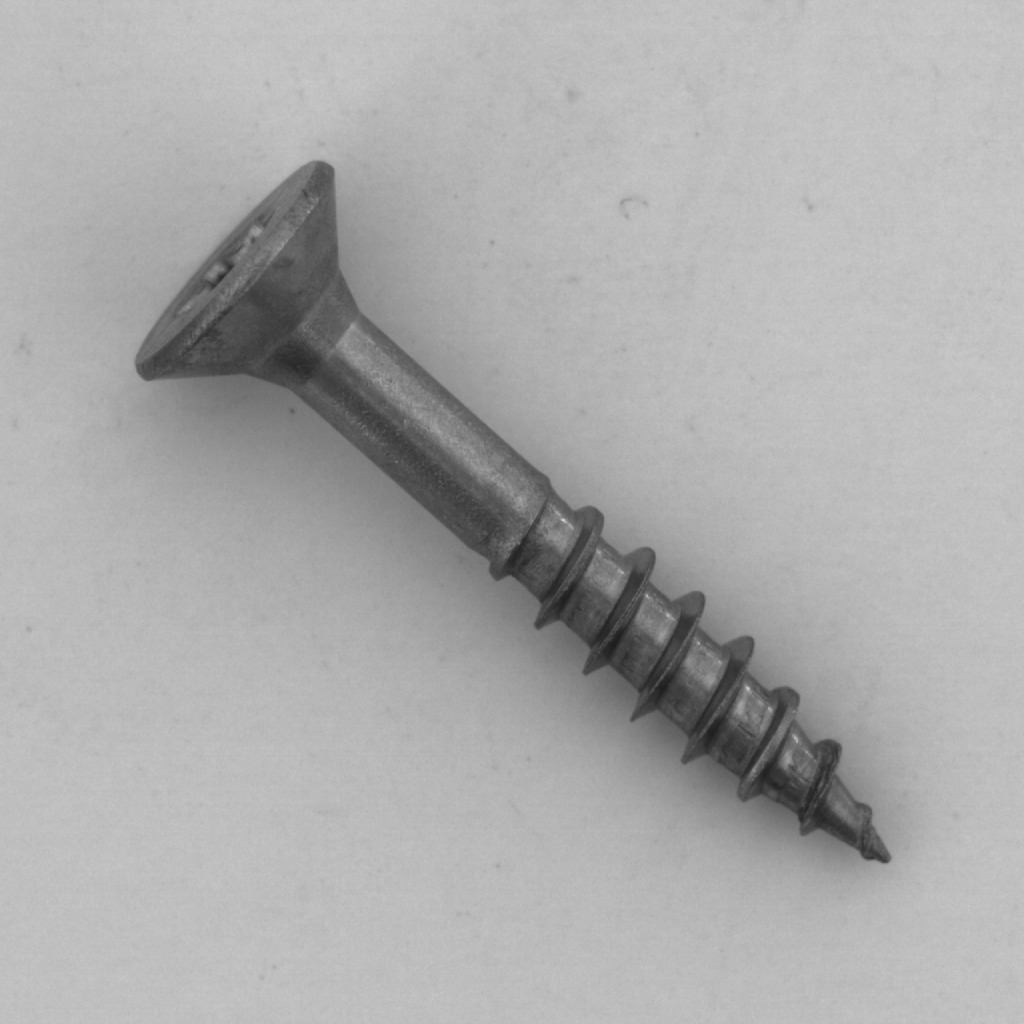
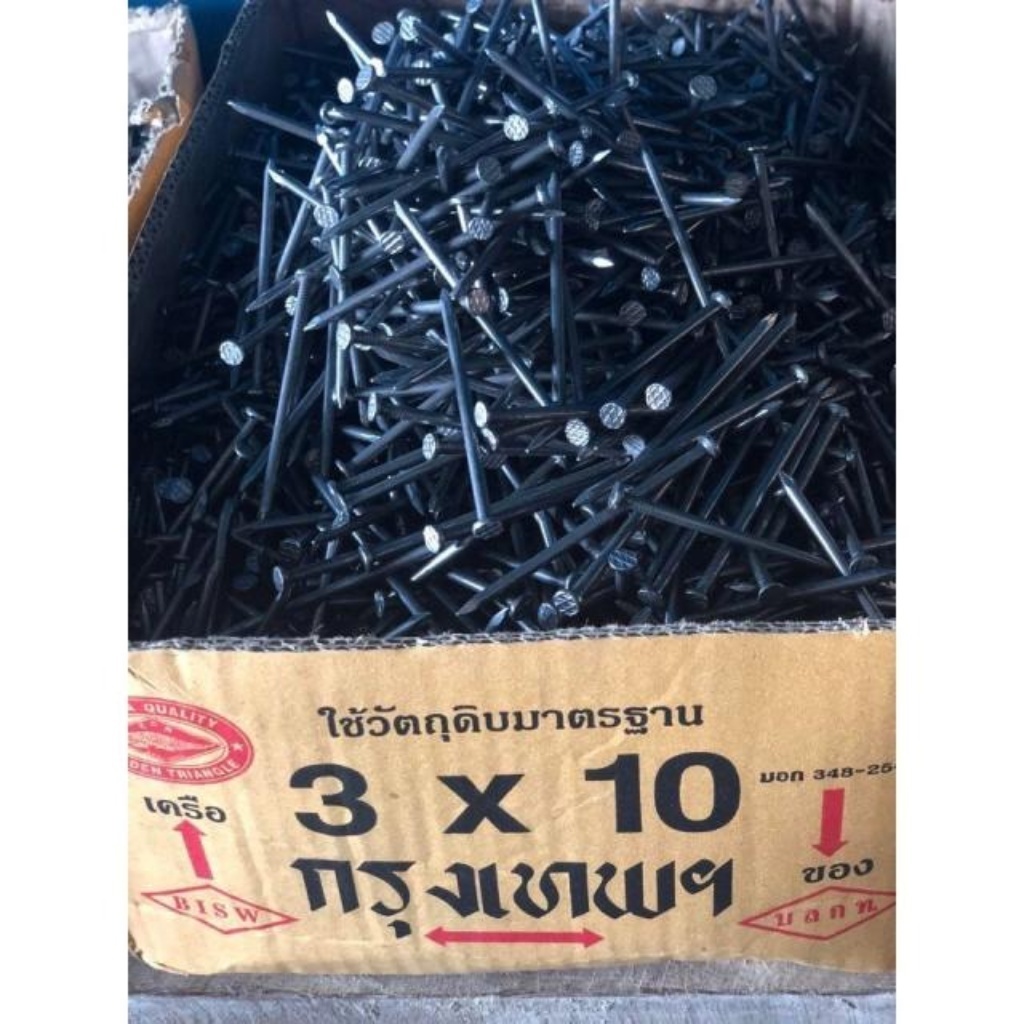
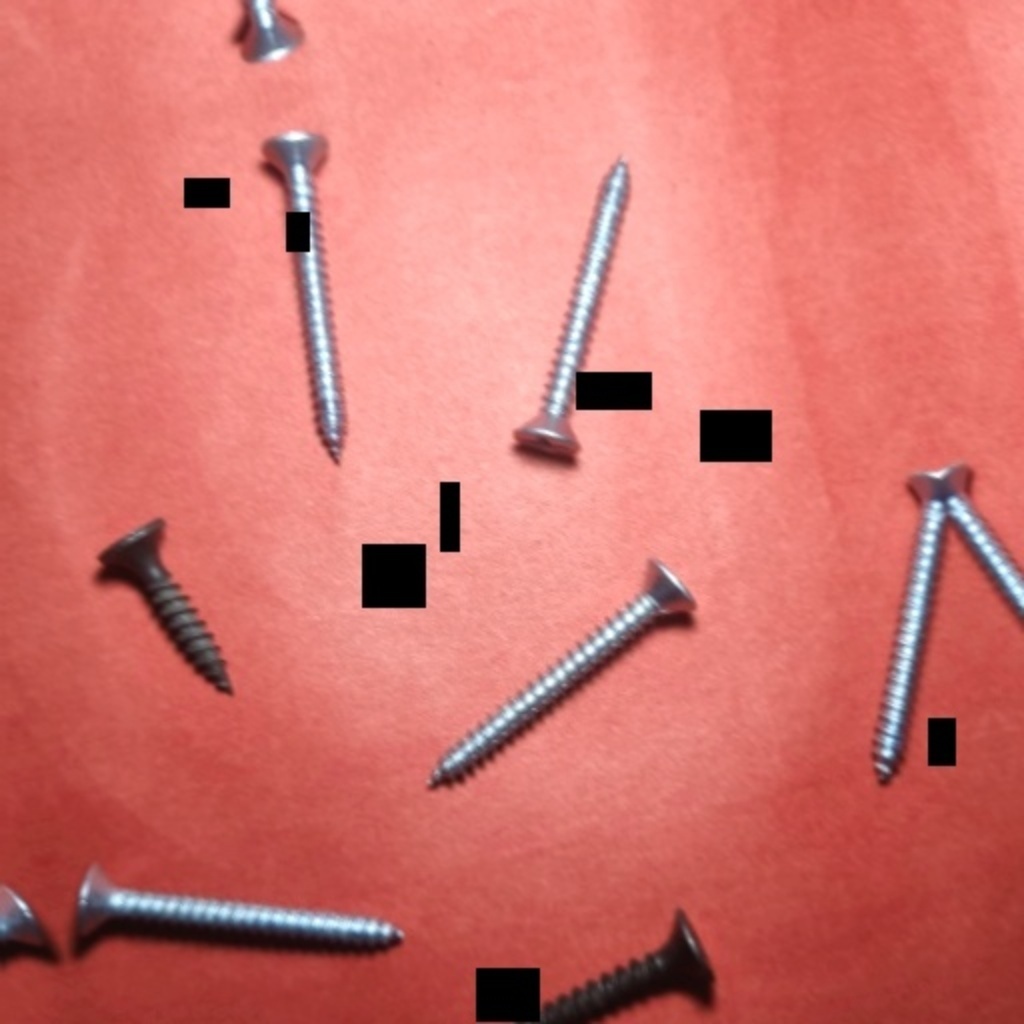
A 3,500+ image corpus assembled from five distinct sources — lab-captured photos, MVTec-AD benchmark images, Roboflow augmentation, programmatic synthetic collages, and hard-negative mining. Together they teach YOLOv8 to reliably locate screws, nuts, and bolts across varied lighting, angle, and background conditions.
3,500+
Training Images
5
Data Sources
94.5%
mAP@50
100+ FPS
Inference Speed
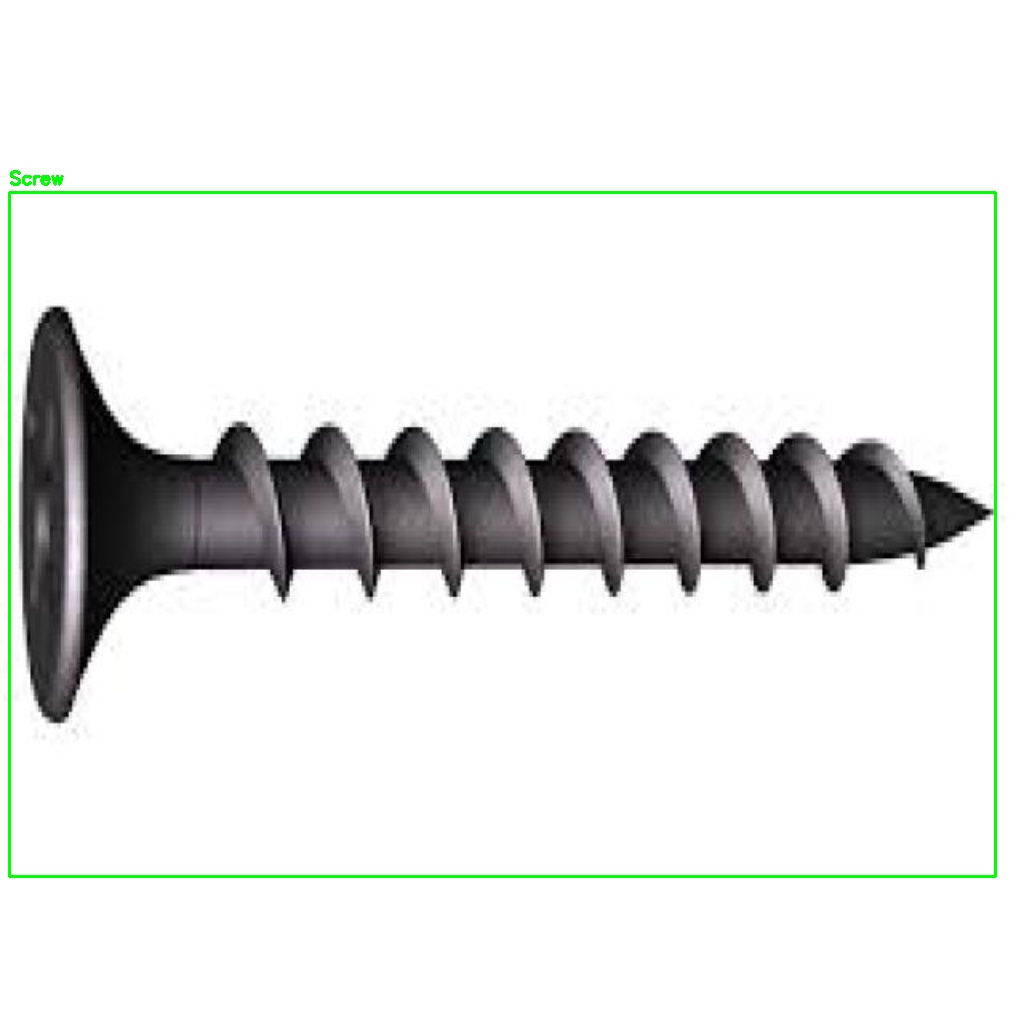
 Annotated
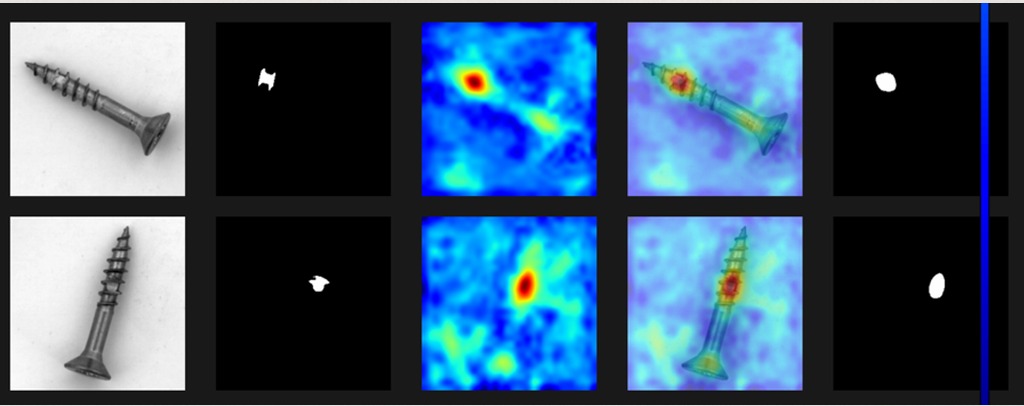
 MVTec-AD
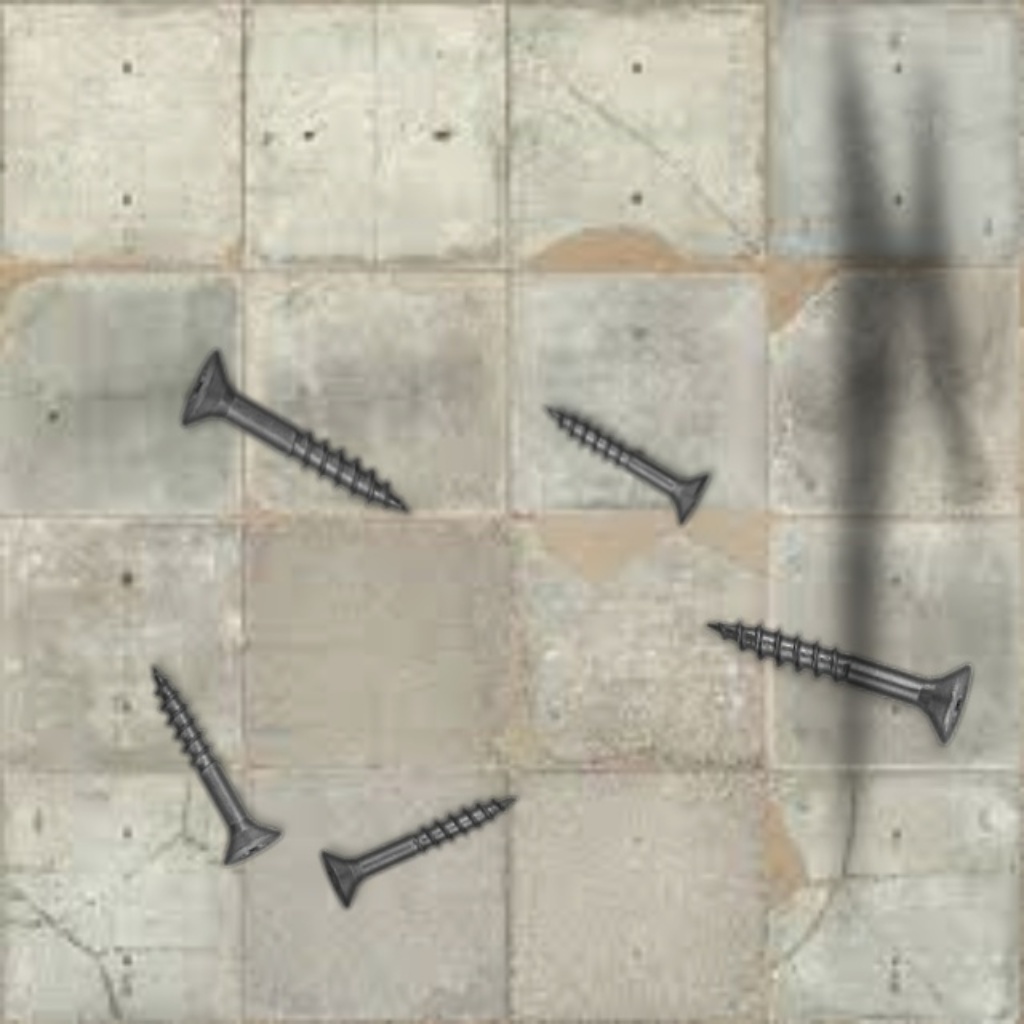 Synthetic
 Negative
 Custom
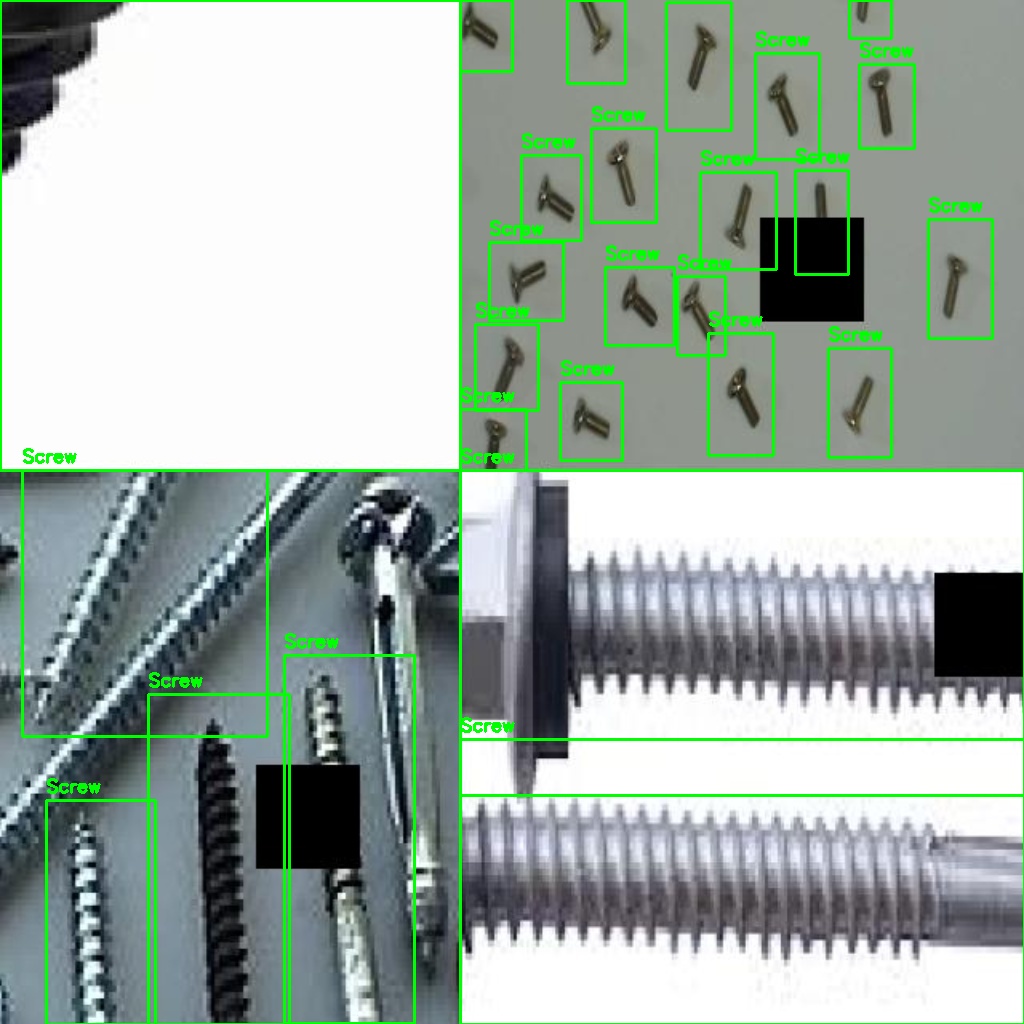 Annotated